
Creative Bioarray offers an assay to assess the differentiation of OPCs (Oligodendrocyte Progenitor Cells) into mature oligodendrocytes.
Here's an optimized general outline for an OPC differentiation assay:
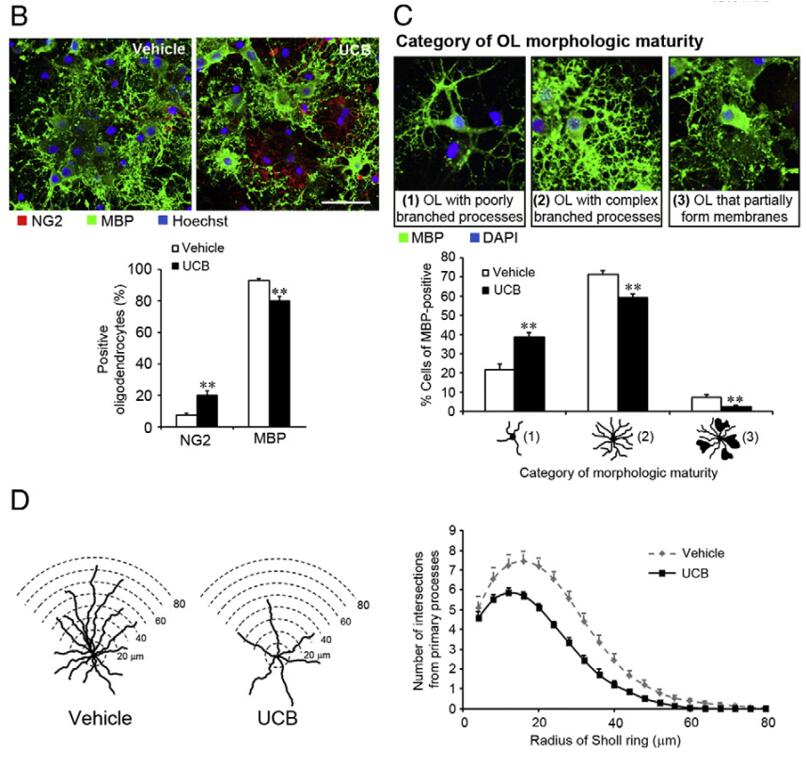 Figure 1. Oligodendrocyte differentiation model and demonstration of possible evaluations.
(B) Using this model of OL culture is possible to evaluate changes in OL differentiation stages. Graph bars represent the quantification of immature OL
(NG2+ staining, red) and mature OL (MBP+ staining, green) from vehicle- and UCB-treated cells at 18 DIV. (C) In this model it is also possible to evaluate
changes in OL morphology through the division of mature OL in different stages of morphologic maturity like: (1) OL with poorly branched processes, (2) OL
with complex branched processes and (3) OL that partially form membranes. Graph bars represent the quantification of OL in these different stages after 18
DIV in the presence or absence of UCB. (D) As demonstrated in this type of culture it is also possible to isolate a single OL in order to perform Sholl
analysis and evaluate changes in OL process branching in vehicle- and UCB-treated cells.[1]
Figure 1. Oligodendrocyte differentiation model and demonstration of possible evaluations.
(B) Using this model of OL culture is possible to evaluate changes in OL differentiation stages. Graph bars represent the quantification of immature OL
(NG2+ staining, red) and mature OL (MBP+ staining, green) from vehicle- and UCB-treated cells at 18 DIV. (C) In this model it is also possible to evaluate
changes in OL morphology through the division of mature OL in different stages of morphologic maturity like: (1) OL with poorly branched processes, (2) OL
with complex branched processes and (3) OL that partially form membranes. Graph bars represent the quantification of OL in these different stages after 18
DIV in the presence or absence of UCB. (D) As demonstrated in this type of culture it is also possible to isolate a single OL in order to perform Sholl
analysis and evaluate changes in OL process branching in vehicle- and UCB-treated cells.[1]
Reference:
1. Barateiro A, Fernandes A. Temporal oligodendrocyte lineage progression: in vitro models of proliferation, differentiation and myelination. Biochim Biophys Acta. 2014;1843(9):1917-1929. doi:10.1016/j.bbamcr.2014.04.018.
Online Inquiry