
Autophagy, a cellular self-digestion process, clears intracellular debris and maintains cell homeostasis via lysosomal metabolism. Under normal conditions, autophagy regulates cell metabolism, energy balance, and contributes to cell development and differentiation. In cancer, autophagy exhibits paradoxical roles, functioning as both a tumor suppressor and promoter. Its impact varies in response to cancer therapy, either conferring resistance or enhancing sensitivity to chemotherapeutic drugs and radiation. Consequently, autophagy presents a potential avenue for improving the efficacy of antitumor drugs and radiation.
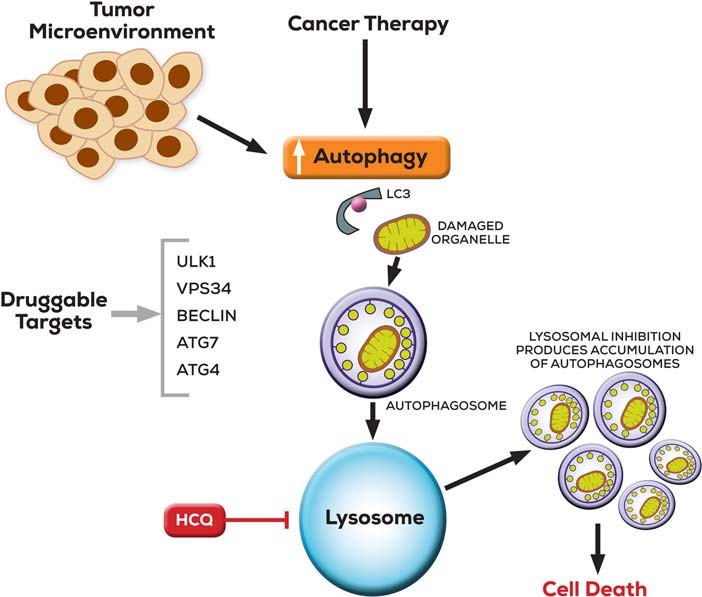 Figure 1. Targeting autophagy in cancer is illustrated. [1]
The tumor microenvironment and cancer treatments enhance autophagy, a process involving the sequestration of damaged organelles and proteins into autophagosomes marked by microtubule-associated protein 1 light chain 3 (LC3). These autophagosomes subsequently merge with lysosomes, facilitating cargo degradation and recycling. Targeting druggable genes related to autophagosome formation reduces their production. Conversely, inhibiting lysosomes, as achieved with hydroxychloroquine (HCQ), results in the accumulation of ineffective autophagosomes. In autophagy-dependent cells, this leads to cell death.
With the support of advanced technology and detection platforms, Creative Bioarray offers researchers comprehensive autophagy detection services. By subjecting normal cultured cells to autophagy inducers or inhibitors, our services enable the observation and precise detection of the autophagic process.
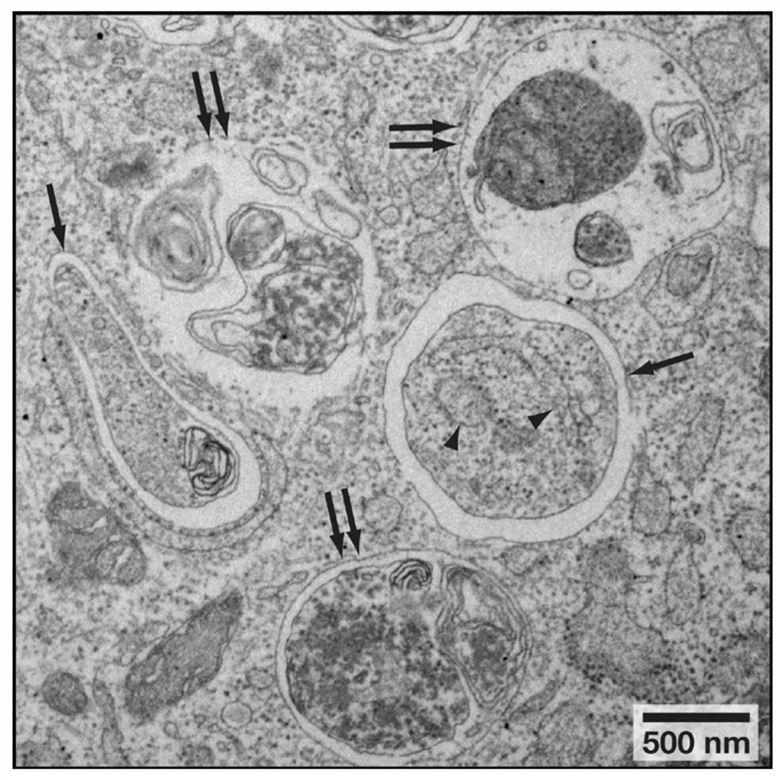 Figure 2. Autophagosome and Autolysosome Morphology. Arrows indicate autophagosomes and double arrows indicate autolysosomes/amphisomes.[2]
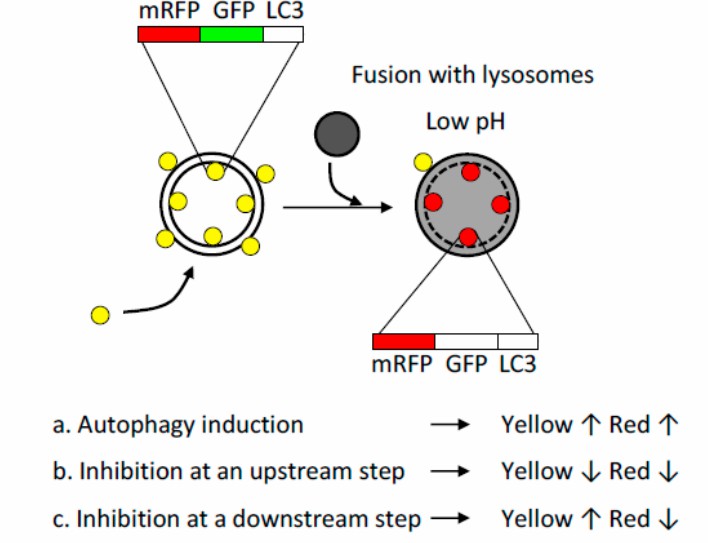 Figure 3. mRFP-GFP-LC3 dual fluorescent indicator system. In the lysosome, the fluorescence of GFP is quenched due to its low pH whereas that of mRFP is stable. Formation of autophagosomes causes an increase in the number of GFP-positive/mRFP-positive (yellow) puncta, and the puncta become GFP-negative /mRFP-positive (red) upon fusion with lysosomes. Autophagy induction results in the increase in both yellow and red puncta, inhibition of autophagy induction results in a decrease in both yellow and red puncta, and inhibition of lysosomal acidification or lysosome fusion results in an increase in yellow puncta and a decrease in red puncta. [3]
During the process of autophagy, LC3-I is converted to LC3-II by enzymatic cleavage and binding to PE. Therefore, the level of autophagy can be estimated by the LC3-II/I ratio.
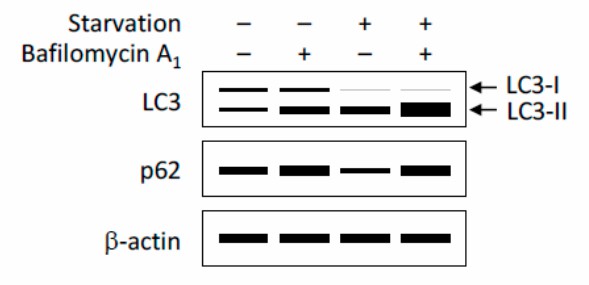 Figure 4. A schematic illustration of detection of autophagic flux by immunoblotting. Both LC3-II and p62 are degraded by autophagy; therefore, the amounts of LC3-II and p62 degraded by autophagy, but not their expression levels, provide an estimate of the autophagic activity. Typically, autophagy induction, for instance by nutrient starvation, converts LC3-I to LC3-II and induces an increase in LC3-II and a concurrent decrease in p62. Inhibition of lysosomal degradation by bafilomycin A1 causes accumulation of LC3-II and p62, and this increment reflects the amount of LC3-II and p62 that would have been degraded by autophagy over the treatment period; [3]
References:
1. Onorati AV, Dyczynski M, Ojha R, Amaravadi RK. Targeting autophagy in cancer. Cancer. 2018;124(16):3307-3318. doi:10.1002/cncr.31335
2. Mizushima N, Yoshimori T, Levine B. Methods in mammalian autophagy research. Cell. 2010;140(3):313-326. doi:10.1016/j.cell.2010.01.028
3. Yoshii SR, Mizushima N. Monitoring and Measuring Autophagy. Int J Mol Sci. 2017;18(9):1865. Published 2017 Aug 28. doi:10.3390/ijms18091865
Online Inquiry